The SEQ Development Brief
Swish Development
Brisbane home values turned in July
Cotality’s national Home Value Index fell 0.7% in July, the largest single-month decline since December 2022, and Brisbane joined the fall at 0.6% (Cotality, 3 August 2026). Sydney dropped 1.4%, Melbourne 1.2%, Adelaide 0.2%. Perth held on at 0.1%.
Brisbane’s median dwelling value now sits at $1,104,094, with annual growth of 14.8% (Cotality via Elite Agent, 3 August 2026). A year of growth at that rate is still substantial. What changed is the direction of the monthly series.
Two details underneath the headline matter more than the headline. The first is revisions. Cotality has been marking the mid-sized capitals down for two months running, and with the July update Brisbane’s fall reads as the second consecutive month, which means June’s reported small gain has been revised away. Perth’s June growth was revised 120 basis points lower, into negative territory for that month. A printed monthly figure is not a fixed number, and a feasibility anchored to one is anchored to something that moves.
The second is regional. The combined regional index fell 0.2% in July, its first decline in that measure since January 2023. Regional Australia has absorbed capital-city weakness for most of this cycle, and the Sunshine Coast has been on the right side of that. It stopped this month.
Auction data says the same thing from a different direction. The combined capitals cleared 49.7% in the week ending 26 July, an eight-week high across 1,415 auctions. Brisbane cleared 29.5% of its 132 auctions, down 5.9 points on the prior week and the weakest result among the major mainland markets (Cotality via Mortgage Professional Australia, 31 July 2026). The national clearance rate is stabilising. Brisbane’s is going the other way.
For anyone selling infill stock in the second half, this is the number that decides whether an end value written in March survives to settlement. Brisbane spent this cycle as the capital that did not fall. That is no longer the base case.
Queensland approvals jumped 33.4% in June
Total dwellings approved nationally rose 7.2% in June to 18,328, seasonally adjusted, against market expectations of a small fall (ABS Building Approvals, released 30 July 2026). Queensland recorded the largest state rise at 33.4%, ahead of New South Wales at 13.2% and Western Australia at 10.7%. Victoria fell 13.9%, South Australia 11.5%, Tasmania 22.5%.
The composition is the story. Private house approvals nationally rose 0.4% to 10,631. Private dwellings excluding houses rose 17.8% to 7,138, after an 11.0% fall in May. The rebound is units and townhouses, not detached houses. Queensland did lead the states on private house approvals as well, up 2.9%, but that is a modest number sitting inside a very large total.
Across 2025-26, 205,249 dwellings were approved nationally in original terms, up 9.2% on the 187,944 approved the previous financial year, and the highest financial-year total since 2020-21.
Last month this brief covered Queensland’s 8.8% May fall as the end of the state’s run above the national trend. June says that fall was a wobble in the unit series rather than a step down. Medium-density approvals are volatile by nature, since a single large project can move a state’s monthly number, so one print in either direction is worth less than the quarter it sits in. The useful read is that Queensland’s pipeline is being refilled by attached product while detached approvals sit close to flat, which is the same shape the commencements data has been showing since December.
Queensland build costs re-accelerated in the June quarter
House construction output prices rose 2.0% nationally in the June quarter, the largest quarterly rise since September 2022, and 5.9% over the year, the highest annual rise since the June quarter of 2023 (ABS Producer Price Indexes, released 31 July 2026). Queensland and New South Wales drove the quarter, up 3.1% and 2.0%. Tasmania recorded the largest quarterly rise at 4.7%.
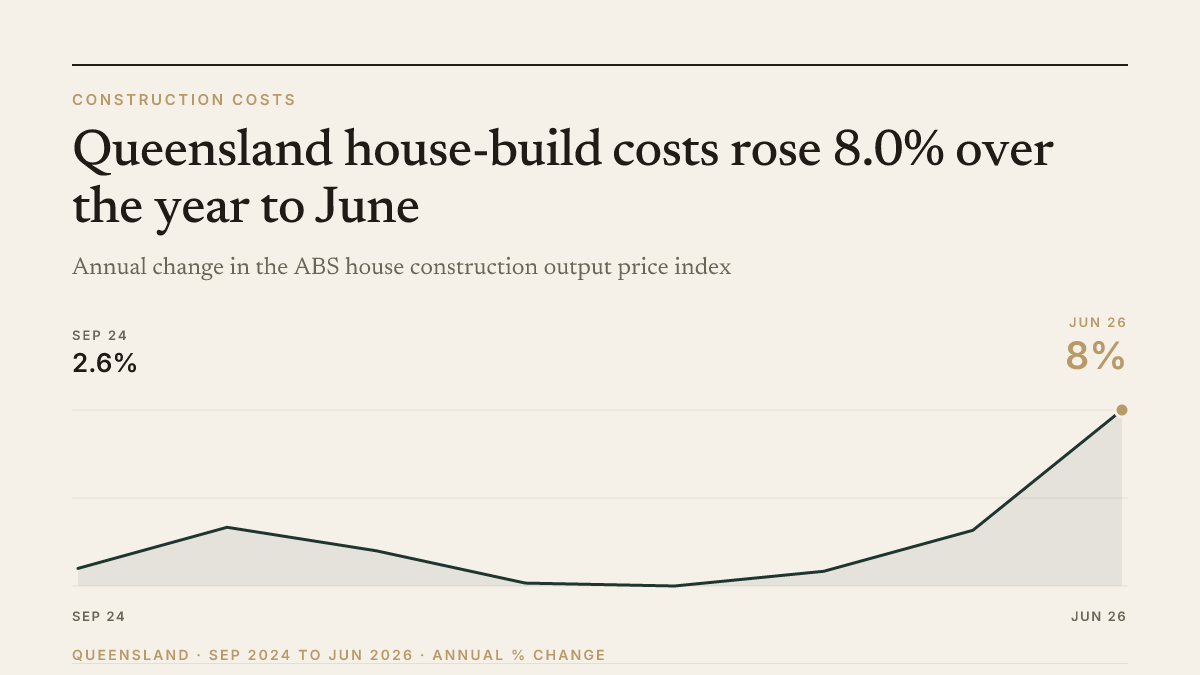
On the ABS published index numbers for Queensland house construction, the state’s annual rate is 8.0% (199.2 in June 2026 against 184.5 in June 2025). Twelve months ago that annual rate was 2.1%.
The ABS names three drivers: fuel surcharges passed through on material deliveries after the Middle East disruption, petroleum-based products, and continued shortages of skilled trades. Plaster products in Brisbane rose 7.7%.
This is the print that does the most damage to a live feasibility. An escalation allowance written a year ago against a 2.1% annual rate is now close to six percentage points short on the house-build line, compounding across a build programme that runs into 2027. It also lands in the same week as the value turn, which is the part worth sitting with: the end value came down and the cost base went up together.
Inflation held its shape in June. The Consumer Price Index rose 3.8% over the twelve months to June 2026, down from 4.0% in May, while the trimmed mean measure the Reserve Bank watches was steady at 3.6% (ABS Consumer Price Index, released 29 July 2026). Housing was the largest contributor to annual inflation at 6.8%, driven by electricity, up 22.4% over the year, and new dwellings at 5.8%. Food and non-alcoholic beverages and Recreation and culture followed at 3.3% each.
Steady underlying inflation with an easing headline is a print that resolves nothing. The cash rate sits at 4.35%, unchanged since the May increase and held in June, with the next Monetary Policy Board decision on 11 August.
Rental vacancy is the one series without a fresh reading. SQM Research’s July figures release in mid-August, after this issue, so the table below carries the June print of 1.3% nationally with Brisbane at 0.9%.
Sunshine Coast
Sunshine Coast Council approved a 126-unit residential development at 5 Sippy Downs Drive, lodged by Vanderbilt Gina 5 Pty Ltd through Adams and Sparkes Town Planning (Sunshine Coast News, 22 July 2026). The mix is 12 one-bedroom, 104 two-bedroom and 10 three-bedroom units in the High Density Residential zone, and the permit carries a six-year currency period. A two-bedroom-heavy scheme at that scale is priced for the rental and downsizer market rather than the family buyer, which is a reasonable read of where Sippy Downs demand actually sits.
At Mooloolaba, the site at 123 Mooloolaba Esplanade on the Venning Street corner is now clear. The former two-storey commercial building came down in June, and construction documents nominate 31 July as the proposed start on the approved 11-storey, 34.916-metre tower, with completion anticipated in June 2028 (Sunshine Coast News, 24 July 2026). The building holds nine apartments over a ground-floor shop, on a site with a 30-metre limit. A separate earthworks and infrastructure application is still in council’s information-request stage.
Nine apartments in eleven storeys is the shape of the Mooloolaba beachfront now: very few, very large, and only viable at a price point that carries the land. It is worth watching what the earthworks application costs, because that is the number that decides whether the same arithmetic works one street back.
The squeeze arrived from both ends in one week.
Brisbane values fell 0.6% in July while Queensland house-build costs rose 3.1% in the June quarter. Feasibilities usually absorb one of those. Absorbing both at once takes the margin out of anything written before Christmas that has not yet gone to contract.
Escalation allowances are the exposed line.
Queensland’s annual house-build escalation went from 2.1% in June 2025 to 8.0% in June 2026. A contract priced against the older rate carries a gap of close to six points on the build line, and unlike a valuation, that gap does not revise back.
The approvals rebound is attached product, not houses.
National house approvals rose 0.4% in June against 17.8% for everything else. Queensland’s 33.4% headline sits on that same base. Anyone reading the state number as a broad recovery in detached house-and-land is reading a unit-driven series.
Brisbane’s clearance rate is running ahead of its value series.
The combined capitals hit an eight-week high of 49.7% in the week ending 26 July while Brisbane cleared 29.5%, the weakest major mainland market. Clearance has led price by a few months each time it has moved this far, and Brisbane’s is still falling as the national measure steadies.
The regional hedge stopped working.
The combined regional index fell 0.2% in July, its first decline since January 2023. Sunshine Coast and Gold Coast stock has spent this cycle benefiting from capital-city buyers stepping out of Sydney and Melbourne. That flow is what the regional index has been measuring, and it has turned.
Housing is the sticky part of the inflation problem.
Headline CPI eased to 3.8% while the trimmed mean held at 3.6%, and housing was the largest single contributor at 6.8%, with new dwellings at 5.8%. The component keeping rates restrictive is the same component being built.
Mid-August 2026: SQM Research July residential vacancy release, the first read on whether June’s easing to 1.3% continued.
August 2026: APRA quarterly ADI Property Exposures release for Q1 2026, covering the debt-to-income cap share.
26 August 2026 (approx): ABS monthly Consumer Price Index for July, the last inflation print before the September board meeting.
1 September 2026 (approx): Cotality August Home Value Index, the print that shows whether Brisbane’s July fall was one month or a trend.
1 September 2026: ABS Building Approvals for July, per the ABS release calendar. The test of whether Queensland’s 33.4% June jump holds.
Second half of 2026: further successful projects announced from the doubled $1 billion Residential Activation Fund Round 2 pool.
Subscribe
Not yet on the list?
The SEQ Development Brief lands Tuesday mornings — the big residential development moves across South-East Queensland's twelve councils, plus the occasional update on what we're building. Free.