The SEQ Development Brief
Swish Development
The rate call has split the market from the forecasters
Ten of the twelve economists tracked by the OurTop10 Rate Prediction Index expect the Reserve Bank to hold at 4.35% on 29 September. ASX futures imply a 54% chance of a 25 basis point rise (Elite Agent, 8 September). Rises are called by Sally Auld at NAB and Phil O’Donaghoe at Deutsche Bank. ANZ, Commonwealth Bank, UBS and Goldman Sachs have moved their expected timing to November, and Westpac expects no increase at all this year. The index blends both sides to 62.4% hold and 35.6% rise.
What opened the gap was the June quarter national accounts on 2 September. GDP rose 0.4% for the quarter and 2.1% over the year, against economist forecasts of 0.3% and 1.8% (ABS, 2 September). Growth for the 2025-26 financial year came in at 2.4%. That followed a July trimmed mean that would not move off 3.6%. An economy running warmer than the Reserve Bank projected, with core inflation stuck, is the case for going again.
Be careful with the probability numbers themselves. They disagree across sources, and they have moved several times in the week since the print. What holds across all of them is the shape: market pricing shifted materially toward a rise after 2 September, most surveyed economists did not follow, and a 25 basis point move would take the cash rate from 4.35% to 4.60%.
For a developer the useful part is not the odds. It is that November is now priced as near certain across both camps even where September is not, so the question has narrowed from whether the next move is up to when. Facilities drawn through the back half of this year should be stress-tested at 4.60%, and interest during construction on anything running past Christmas is being modelled on a rate that most of the market no longer expects to be 4.35%.
The value fall has stopped being a big-city story
National dwelling values fell 0.9% in August, a fifth consecutive monthly decline that leaves the index 3.6% below its March 2026 peak (Cotality, 1 September). Every capital except Darwin fell. Sydney led at 1.4%, then Melbourne and Canberra at 1.1%, Brisbane at 1.0%, Adelaide and Perth at 0.8%. The combined regional index fell 0.4%.
Brisbane at 1.0% is its steepest monthly fall of this cycle, and it has now moved from the strongest capital in the country to the middle of a national decline inside four months.
The number that matters more is 93%. That is the share of capital city suburbs that recorded a value fall across the three months to August. Tim Lawless described the downturn as having become much more generalised, and the suburb-level spread is the evidence for it. A fall concentrated in a handful of expensive submarkets is a composition story. A fall in 93% of suburbs is a market.
Underneath, the stock picture is doing something worth reading twice. Advertised listings in the four weeks to 30 August sat 24% above the same period last year and 8% above the five-year average. New listings coming to market were 6% lower than a year ago and 8% below the five-year average. Sales volumes ran 15.5% below last year and 11.5% below the five-year average.
Stock is not piling up because vendors are rushing in. It is piling up because what is already listed is not selling. That is a demand problem presenting as a supply number, and it is the version that takes longer to clear.
Building approvals gave back some of what they gained. Total dwellings approved fell 3.6% to 17,687 in July, seasonally adjusted, with private sector houses down 4.2% to 10,199 and private dwellings excluding houses down 0.4% to 7,119 (ABS, released 1 September). Queensland fell 13.9%, the largest decline of any state, four months after the state posted the largest rise. New South Wales fell 8.1% and Western Australia 0.3%, while Tasmania rose 15.2%, Victoria 9.7% and South Australia 5.9%. Queensland approved 4,200 dwellings in total and 2,239 private sector houses, the latter down 5.5%.
The seasonally adjusted series is the one that generates headlines and it is also the one that swings 30 points month to month. The trend estimate rose 0.8% to 18,365. The Treasury’s read on the same data is that trend approvals have now risen for 18 months and have held above 18,000 for three of them. Both things are true at once, and only one of them is a signal.
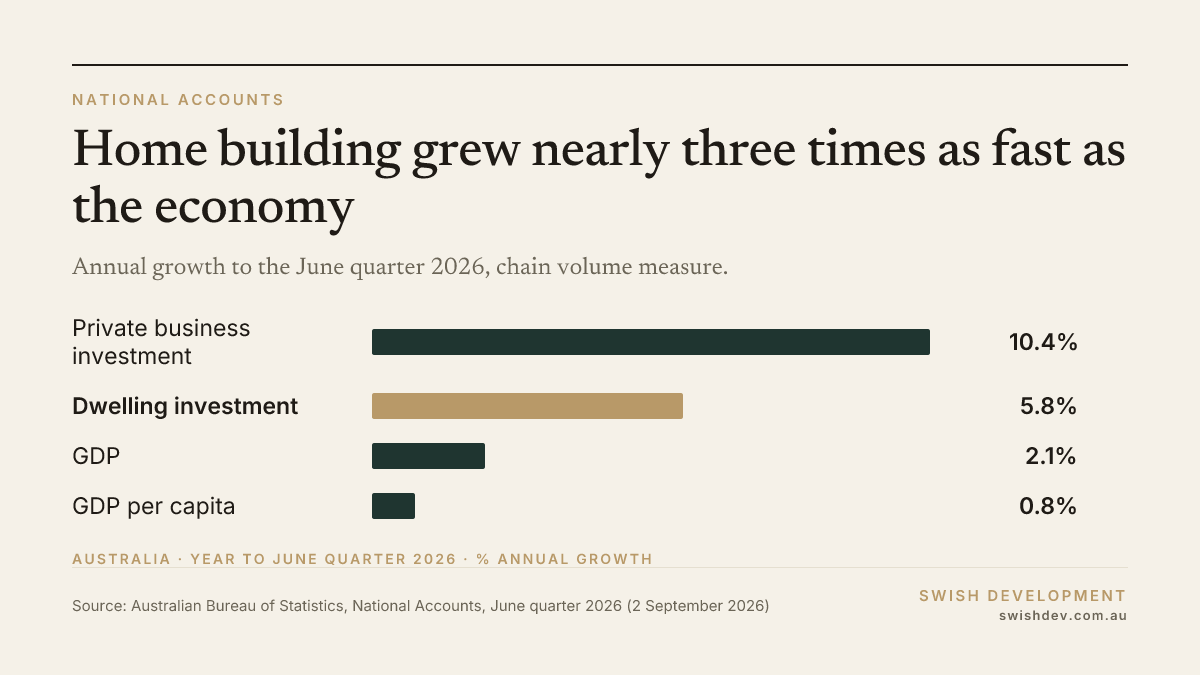
Residential construction is following the trend rather than the monthly print. Dwelling investment grew 1.6% in the June quarter and 5.8% over the year, up from 1.5% and 4.2% the quarter before (Treasury, 2 September). The value of residential building approved did fall 4.9% to $11.26b in July, while non-residential approvals rose 14.4% to $9.93b.
Private credit tightened before the collapse, not after
Administrators were appointed to Bathla Group on 25 August. Teneo Financial Advisory Australia took 542 companies across the group, covering 219 construction projects with 45 in active construction, about 2,000 homes being built and a pipeline of around 13,000 more (ABC, 27 August). There are 349 employees on a $3.3m payroll and 43 lenders in the creditor discussions. Universal Property Group, the main corporate entity, reported $3.2b in liabilities as at June 2025. Administrators are seeking about $20m to keep construction moving for five weeks against projected cash burn of roughly $40m from September to December. Managing director Bhart Bhushan attributed the failure to softening sales, tax changes and higher construction costs.
The sequencing is the part worth attention. Centuria Bass paused both redemptions and applications across the Centuria Bass Credit Fund and the Bass Property Credit Fund on 14 August, eleven days before administrators were appointed, and expected the pause to run between two and six months subject to trustee review. MA Financial’s Secured Loan Series began capping monthly redemptions at up to 1% of that series’ funds under management from 25 August. Centuria says the fund continues to operate and to generate income from its underlying investments, with distributions expected to be paid in the ordinary course subject to liquidity, and SQM Research downgraded the Bass Credit Fund over its Bathla exposure while Centuria defended it.
None of that is insolvency. Restricting redemptions is a liquidity management tool and it is the tool these funds are designed to have. What it does mean, mechanically, is that a fund conserving liquidity writes fewer new facilities and looks harder at the ones it holds.
Here is why that lands on a Sunshine Coast duplex or a 20-unit Brisbane infill site rather than staying a Sydney story. The mid-market developer’s first call has not been a major bank for a couple of years now. It has been a private credit manager or a non-bank, because that is where the presale flexibility lives. When the funding behind those managers gets slower, the effect shows up as longer credit turnaround, tighter conditions precedent, more equity asked for at the same gearing, and facilities that were indicatively approved in June being re-cut in September. It rarely shows up as a lender saying no.
The practical response is unglamorous. Find out who funds your funder. If a facility is being negotiated now, ask where the money behind it comes from and whether that vehicle has had any redemption activity this year, because the answer changes how much weight an indicative term sheet deserves. Build more time into the finance milestone in any contract being signed this quarter. And if a project’s feasibility only works on non-bank terms available in the first half of this year, price it again on what is available now.
This is a report on what lenders and funds have done and what it means operationally. It is not advice on any facility, fund or lender, and it is not a view on the merits of any investment.
The question is when, not whether.
Market pricing and most surveyed economists disagree about 29 September, but a November rise is priced as near certain on both readings (Elite Agent, 8 September). Feasibilities carrying 4.35% through 2027 are using a number almost nobody now defends. Stress-testing interest during construction at 4.60% is the minimum, and the case for locking rate on drawn facilities is stronger this month than last.
Listings are rising because sales stopped, not because vendors started.
Advertised stock sat 24% above last year in the four weeks to 30 August while new listings ran 6% below and sales volumes 15.5% below (Cotality, 1 September). Absorption, not supply, is what changed. For anyone modelling a presale program, the relevant assumption to move is time on market, not price.
Read the trend series, not the monthly print.
Queensland approvals fell 13.9% in July after leading the country four months ago, but the national trend estimate rose 0.8% to 18,365 and has climbed for 18 months (ABS and Treasury, 1 and 2 September). The seasonally adjusted number is the one that moves markets and the one least worth acting on.
Construction activity and property values have decoupled.
Dwelling investment grew 5.8% over the year to June while values have now fallen for five straight months. Builders are working through a pipeline approved when the market looked different. That gap is where margin gets squeezed, and it usually closes through completions arriving into a softer market rather than through prices recovering to meet the pipeline.
Funding risk has moved upstream.
The funds that restricted redemptions did so before Bathla’s administrators were appointed, not after (Financial Standard, 14 August). Counterparty diligence that stops at the builder and the buyer misses the layer that actually moved first. Ask what sits behind the lender.
Brisbane has lost its premium to the national cycle.
Brisbane fell 1.0% in August, its steepest of the cycle, having been the strongest capital in the country four months ago (Cotality, 1 September). The southeast is no longer decoupled from the national correction, and residual-value assumptions written on Brisbane outperformance need a fresh look.
24 September 2026: ABS Labour Force, August 2026.
29 September 2026: RBA Monetary Policy Board decision, the one the market and the forecasters disagree about.
30 September 2026: ABS Consumer Price Index and ABS Building Approvals, both for August 2026.
Second half of 2026: APRA finalises the credit risk capital changes consulted on to 7 September, including the residential development presale test, for a proposed 1 April 2027 start.
30 September 2029: Narrow-lot exemption from liveable housing requirements expires under the Modern Homes Standards.
Subscribe
Not yet on the list?
The SEQ Development Brief lands Tuesday mornings — the big residential development moves across South-East Queensland's twelve councils, plus the occasional update on what we're building. Free.